


PIX Connect: how to export temperature-time diagram
This video explains which measurement data can be obtained and how it can be exported to Excel or other programs.
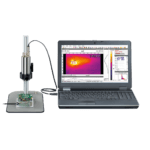
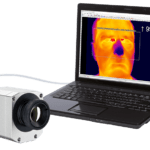
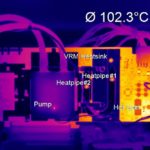
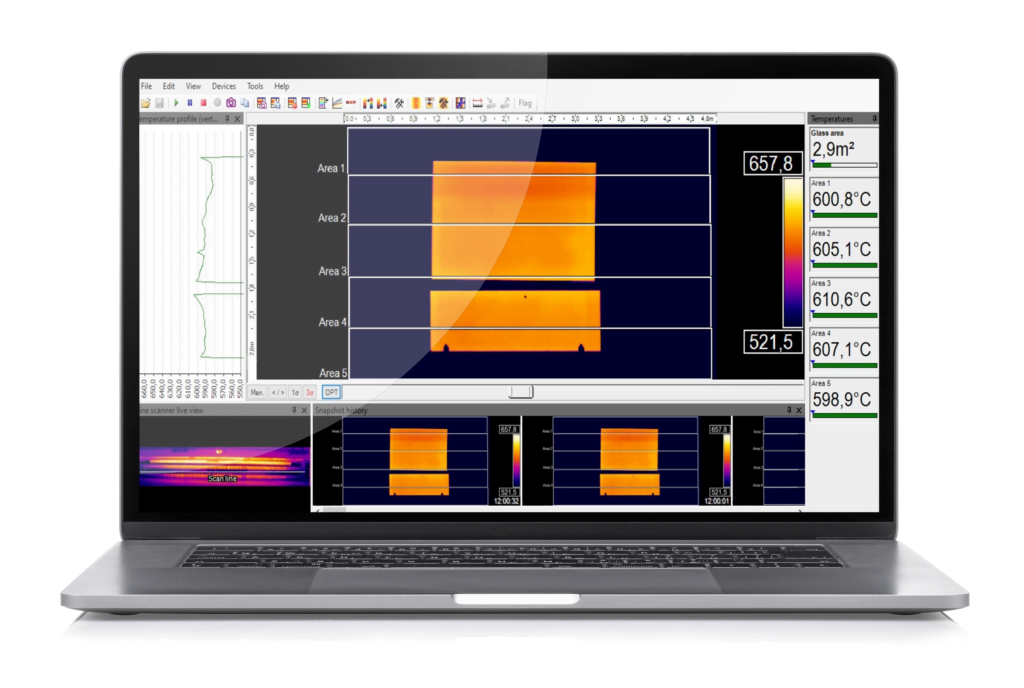
In the test setup, three objects with different temperature measuring fields are recorded with the software. For visualization, the software allows the representation in a temperature-time diagram. The visualized data is captured completely and can be saved individually. The data can then be opened in Excel and other programs. In addition, it is shown how the Excel data can be displayed in a 3D graph.
Downloads
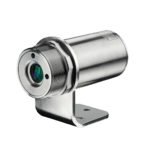
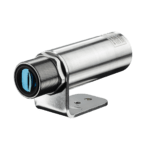
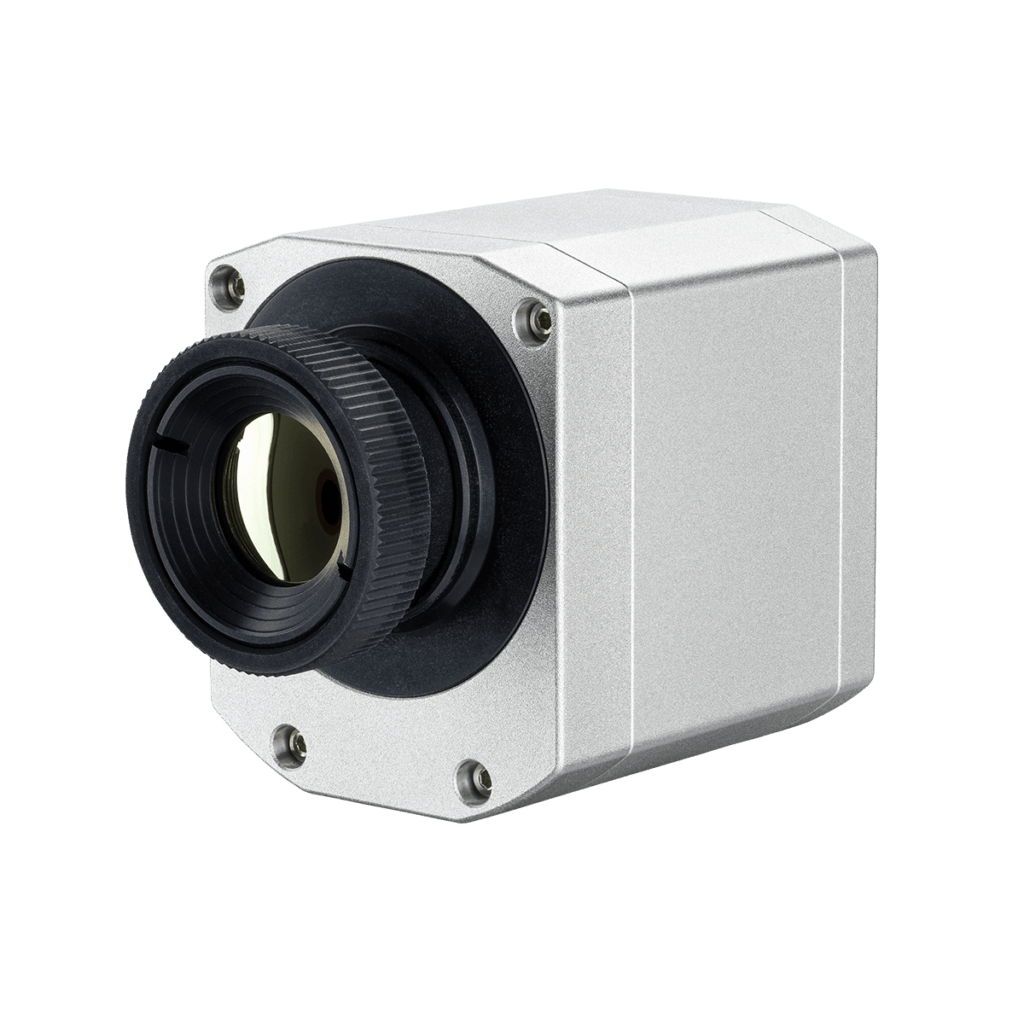
Products discussed

Contact for Advice and Sales Worldwide
We offer comprehensive advice for your individual applications
Our experienced application engineers ensure competent and reliable customer service in the field. In addition, Optris works closely with numerous distribution partners worldwide.
International
Ferdinand-Buisson-Str. 14
13127 Berlin, Germany
Phone: +49 (0)30 500 197-0
E-Mail: sales@optris.com
Internet: www.optris.com
Managing Director:
Dr.-Ing. Ulrich Kienitz
